The Changing Landscape of Massillon Football – Part 4: Scheduling
This is the fourth of a 7-part series, which includes the following installments:
- Part 1: Offensive Formations
- Part 2: Defensive Formations
- Part 3: Passing Frequency
- Part 4: Scheduling
- Part 5: Roster Size
- Part 6: Stadiums
- Part 7: Game Attendance
Nothing grabs the attention of Tiger fans in the off-season more than the schedule of games for the campaign to come. In fact, for the massillontigers.com website, the “Future Schedule” page receives more traffic than any other during that time. And why not? As an independent school, devoid of any league association, the year-to-year slate constantly changes and lately has encompassed a plethora of out-of-state teams, for a variety of reasons.
Part 4 of this series explores the evolution of the Massillon schedules, focusing particularly on strength-of-schedule aspect from the time of Paul Brown to the present. It also studies the relationship between the the trend of strength-of-schedule and the trend of winning percentage.
Massillon’s schedules have changed drastically over the years due to a number of factors. When Paul Brown was the head coach, in the 1930s, travel from city to city was difficult due to the limitations of the vehicles at that time and the lack of an interstate highway system. So, teams tended to play primarily opponents that were within close proximity. That changed in the 1950s with better roads and buses.
The sportswriters poll also had an impact, especially since the Tigers were the team to beat in order to win a state title. There were many instances when good teams from the around the state provided the challenge. An example was Toledo Waite in 1940. They finished 9-1 that year, but lost to Paul Brown’s Tigers, 28-0. Another was Cleveland Cathedral Latin, which played several games. And let’s not forget Niles McKinley and the 1964 game at the Akron Rubber Bowl, which the Tigers won 14-8.
For a short while, the All-American Conference provided a solid group of teams that would fill half the schedule on an annual basis. Then, there was the playoff system. No longer was it necessary to schedule the best teams to win a title. Conversely, it was now prudent to avoid them in order to improve the odds of qualifying for post-season play. Titles would be left for the tournament. Presently, Massillon has become one of the best teams in the country and potential opponents are avoiding them like the plague. Such is the evolution of the schedule. In essence, the Tigers have now become victims of their own success.
Strength-of-Schedule
This author has developed a rudimentary calculation that rates a season’s schedule. Although on an individual opponent basis it lacks the complexity of an algorithm-based method, collectively over an entire season it provides a fairly good rating.
Here’s how it works. Each opponent receives a numerical rating based on its performance over the season, as follows:
- 3 points for a large parochial school, like Lakewood St. Edward or Cincinnati Moeller
- 2 points for a public school that won at least seven games or participated in the playoffs in the regional quarterfinals or better
- 2 points for a medium-sized parochial school
- 1 point for a public school that won less than seven games
- 0 points for a public school that couldn’t get out of its own way
The points are then added together (adjusted if there were less than ten games) to give a season rating. For example, if Massillon played ten public school teams and they all won at least seven games, then the schedule would be rated at 20.
The Early Years
Massillon’s first few football seasons were against a hodge-podge of opponents, since there were few schools around at that time also playing the sport. For example, the locals played three games in 1891 during their first year of competition, two against the Massillon Ex-Highs and one against Beta Theta Pi Fraternity of Wooster College. Shortly after, teams such as Pumpkin Hill, Massillon Alumni, Massillon Actual Business College, Claytown and Smoky Hollow began to appear. But it was not until 1903 that the first recognizable football schedule was assembled, one that contained eight games. From thereafter, several common opponents were scheduled, many of which have appeared even in recent years.
From those initial seasons up until the time of Paul Brown the Tigers compiled a record of 160-102-18 (.608), playing the likes of Canton McKinley, Warren Harding, Alliance, Barberton, Wooster and New Philadelphia. It was also when many long-time rivalries developed. Below is a short list of total games played against these teams all-time:
- Canton McKinley – 134
- Warren Harding – 88
- Alliance – 75
- Mansfield – 54
- Steubenville – 49
- Barberton – 46
Paul Brown and prior to the All-American Conference
Paul Brown became the head coach in 1932 and since that time the Tigers have compiled a record of 788-197-18 (804). But it would surprise many to learn that Brown’s schedules were initially some of Massillon’s worst ever. His ratings for the first five years averaged just 9.2, including three seasons of 6, 7 and 7. Within those schedules was a steady diet of teams such as Wooster, Akron East, Akron South, New Philadelphia and Dover. But once Brown started winning state titles, the schedules did improve a bit with the inclusion of a few of the better teams from around the state. In his final four years, Brown’s schedules were rated at 14, 14, 12 and 15.
Following Brown, a rating of around 13 seemed to become the norm. And that continued through the era of the sportswriters’ polls, from 1946 to 1971.
The All-American Conference
One would expect that the schedule would become more difficult during the time of the All-American Conference (1963 to 1979). The conference had the likes of Canton McKinley, Warren Harding, Niles McKinley, Steubenville and Alliance. But the schedule rating remained the same, at around 13. That’s because the members believed that if they went undefeated in the league, there was a great chance of winning the state title and they didn’t want to jeopardize that by playing difficult non-conference teams.
Post-All-American Conference and Into the Playoff Years
After the conference broke up and following the introduction of the playoff system, the advantage of winning the conference was gone. Now, it was necessary to schedule enough good teams to qualify for the playoffs, since the Harbin computer numbers were now in play, and the system required a sufficient number of opponent wins in order for a team to qualify for post-season play. And that was exasperated further by the limitation imposed by the OHSAA on the number of qualifying teams, a number that was initially much lower than today. And, as a school never knew in advance what kind of season an opponent would have, it was necessary to schedule as many good teams as was feasible, but not those where they would be a decided underdog. For Massillon then, the average schedule rating improved from 13 to 14.
Parochial Schools on the Slate
It didn’t take long for the large parochial schools to begin dominating the playoffs, starting with Cincinnati Moeller in 1975 and then Cleveland St. Ignatius in 1988. Today, it is Lakewood St. Edward. Two events occurred around that time. First, it became more difficult for the Tigers to schedule other public schools, aside from them having locked-in conference games, because those schools did not want to risk a loss and thereby jeopardize their opportunities to qualify for the playoffs. And second, Massillon was led by this constraint to play the large parochial schools, who were more than willing participants, as they had their own scheduling difficulties. So, in 1989 the large parochial schools began to appear on the schedule on a regular basis, beginning with Moeller. The Tigers did take their lumps, but they were also able to learn what needed to improve in order to be competitive in these games. With those schools now on the schedule, the average rating climbed to 15.6.
From 1989 to present, Massillon’s records against these schools in both the regular season and the playoffs are as follows:
- Cleveland St. Ignatius: 2-8 / 0-3
- Cincinnati Moeller: 2-9 / 0-0
- Lakewood St. Edward: 4-4 / 1-0
- Cincinnati Elder: 1-0 / 0-0
- Cincinnati St. Xavier: 0-0 / 0-1
- TOTAL: 8-21 / 1-4
Nate Moore and the Present
During Moore’s first five years, the schedule averaged 15.0. But as the Tigers began their climb to national prominence, so did the rating, as scheduling Ohio public schools became that much more difficult and more and more out-of-state opponents began to appear. Over the last four years the rating has averaged 20.0. And the schedule for 2024 is looking like it may be even higher, from 22 to 23.
Calpreps.com, a national algorithm ranking system, lists the top programs in the state of Ohio for both the last twenty years and the last five and confirms Massillon’s now prominent position. For the last twenty years, Massillon is ranked 12th in the state. But over the last five, it is ranked 3rd, as shown below, accompanied by the teams’ win-loss records:
- Lakewood St. Edward (39-5)
- Akron Hoban (50-8)
- Massillon (49-7)
- Springfield (44-12)
- Lakota West 43-7)
- Cincinnati St. Xavier (32-17)
- Toledo Central Catholic 48-5)
- Chardon (50-6)
- Cincinnati Moeller (37-17)
- Avon (37-17) (48-7)
In addition, the Tigers last year were ranked in the Top 25 nationally by Calpreps.com.
Obviously, the higher rankings within an algorithm-based system are influenced heavily by a strength-of-schedule component (something that is lacking within the Harbin system).
Winning Percentage vs. Strength-of-Schedule
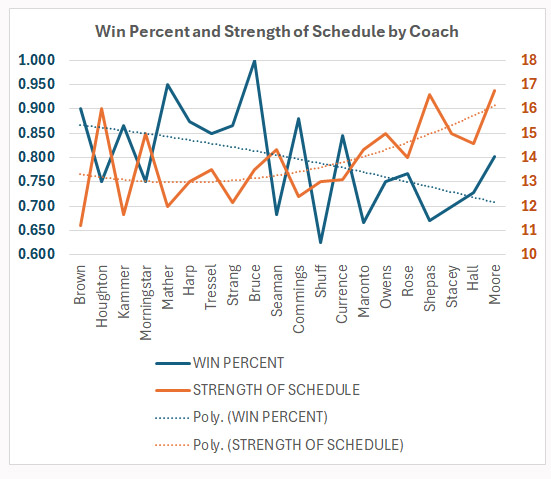
There has been an obvious impact on Massillon’s winning percentage over time as the strength-of-schedule has steadily climbed, from Paul Brown’s overall average rating of 11.2 to Nate Moore’s average of 17.2. The chart below overlays these two parameters. Yes, the Tigers don’t win nine or ten games every year anymore, but it’s certain that the increased difficulty of the schedule has something to do with this. Nevertheless, Massillon still retains one of the best programs in the state, if not the country.

Interestingly, although the winning percentage has declined for some eighty years, it has seen an uptick in the last few years, in spite of the enormous schedule rating. That is a tribute to Nate Moore and his assistant coaches, who collectively with the players have returned the Tigers to a national level of performance. It’s no wonder that the other public schools in Ohio are running away and scheduling opponents in Massillon has become that much more difficult.

