The Changing Landscape of Massillon Football – Part 3: Passing Frequency
This is the third of a 7-part series, which includes the following installments:
- Part 1: Offensive Formations
- Part 2: Defensive Formations
- Part 3: Passing Frequency
- Part 4: Scheduling
- Part 5: Roster Size
- Part 6: Stadiums
- Part 7: Game Attendance
All offensive football formations over the past 120 years have contained within them an element of the passing game. But it’s no secret that teams today throw the ball more than those of earlier years. And they are more effective now when they do. Perhaps it’s the evolution of the game. Or it may be the preferences of specific coaches. Or it might simply be the need to score more points in this era of higher scoring games. Regardless, the pass has had more impact on revolutionizing the game of football than anything else in its long history.
Football began in the late 1800s as a run-only sport. But that all changed in 1906 when the forward pass was legalized in an attempt to make the game safer. Little did the rules-makers know at the time how much the sport would change, particularly when the spread offense was introduced. Part 3 of this series explores the evolution of the passing game from the Massillon perspective in terms of the frequency of passing the ball; or in football vernacular, the run/pass ratio.
As described in “Part 1 – Offensive Formations,” coaches initially shied away from the run, first on account of the debilitating penalties associated with incompletions and then believing the pass not to be a “manly” activity in such a physical sport. But it eventually found itself with the Single-Wing offense, which placed a back at the edge of the line to serve as one of the targeted receivers, along with the end. The Wing-T and the Power-I also used this concept.
Although the forward pass was now becoming an integral part of the game, it was still used at Massillon only 18% of the time through 1975. Many passes were of the long-distance variety. For example, the team season record for yards per completion is owned by the 1959 team, at 24.5, followed closely by the 1970 team (22.8) and the 1949 team (22.7). Only one spread offense team is listed in the Top-10 of the record book: the 2016 team at 19.3, which featured deep receiver Austin Jasinski.
In 1976 Head Coach Mike Currence brought his version of the “Run-and-Shoot” offense to town and suddenly the pass was being used on average 28% of time, a 10% jump in frequency. And this rate continued up until the time of the spread offense, in spite of a variety of different formations employed by different coaches, including the Power-I and the Run-and-Boot.
But the spread finally took hold in 1998 under Coach Rick Shepas and continued under Tom Stacey, Jason Hall and Nate Moore. The percentage of plays that utilized the forward pass jumped once again, this time to 37%. Another step up, of 9%
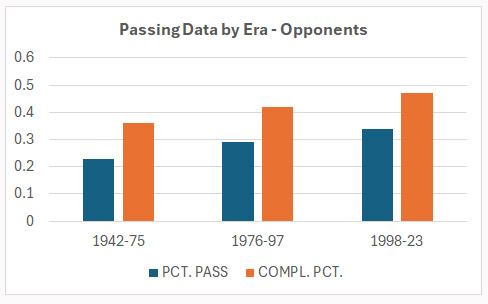
And the opponents followed the same trend: 23% through 1975, 29% through 1997 and 34% to the present.
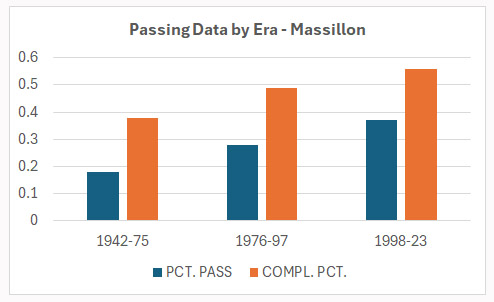
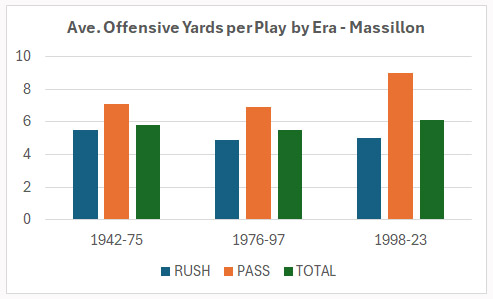
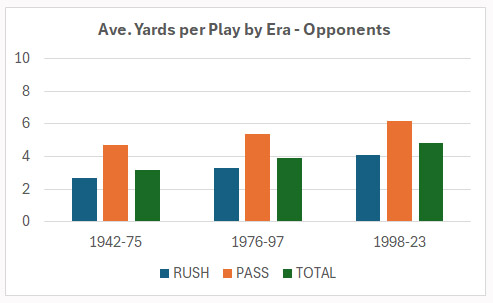
At the same time, the efficiency in the passing game improved immensely. For Massillon, it went from a completion rate of 38% through 1975, to 49% from 1976 to 1997, and to 56% with the spread offense. For the opponents, it also got better, from 36% to 42% to 47%. Interestingly, the yards per completion for both the Tigers (14.2) and the opponents (13.0) has not varied much over time, except during Massillon’s early years (prior to 1976) when they focused mostly on deep throws, averaging 18.9 yards per reception. The charts below summarizes this.
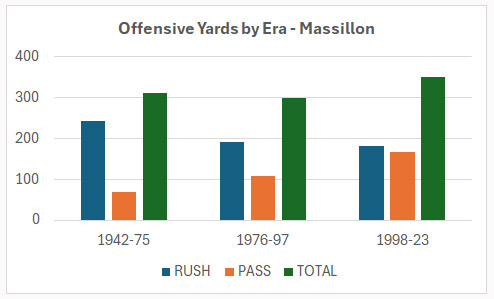
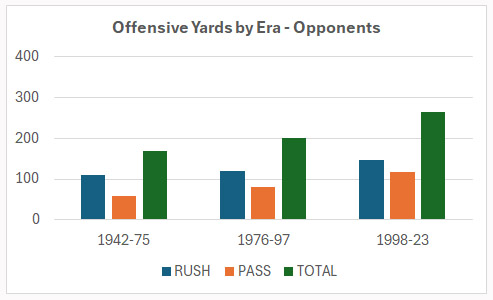
But how effective was the passing game as it evolved? Did it result in more yards? Or more points? For Massillon, there was little difference in total yards when passing made the first jump. In essence, the Tigers, who were maximizing the potential of the running game, just traded rushing yards for passing yards. However, an improvement was definitely shown when the spread offense came into effect. The average total yards jumped from 298 to 350. The opponents, however, did show some improvement in yards when the pass game made the first jump (168 to 200) and another improvement with the second jump (200 to 264). It be explained that the opponents struggled with running ball against the stout Massillon defenses, but then found benefit with the pass. Similar results were also found with “yards per play.” The charts below illustrates this data.
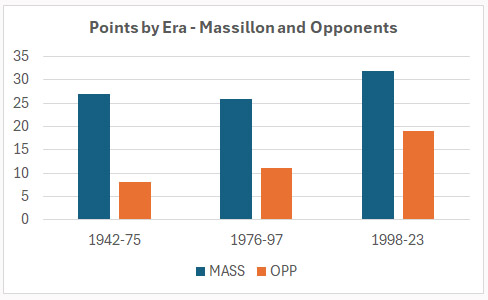
Just as in yards, Massillon did not improve in the scoring column with the first jump, but did with the second jump (26 to 32), demonstrating the effectiveness of the spread offense as opposed to its predecessors. In contrast, the opponents saw a modest improvement in scoring with the first jump (8 to 11), but greater improvement with the spread offense (11 to 19). The chart below illustrates this data.
But there is yet another factor that has influence on this data, particularly the opponent’s: Massillon’s ever-improving strength of schedule. That will be covered in Part 4 of this series.