Breaking Down the Region 7 Playoff Bracket
After ten grueling weeks of regular season football, it’s time to embark on another six games. For, it’s playoff time. Sixteen teams in Region will vie during the next four weeks for a coveted spot in the state final four and a chance to become the 2024 state champion. Here’s a look at Division II, Region 7.
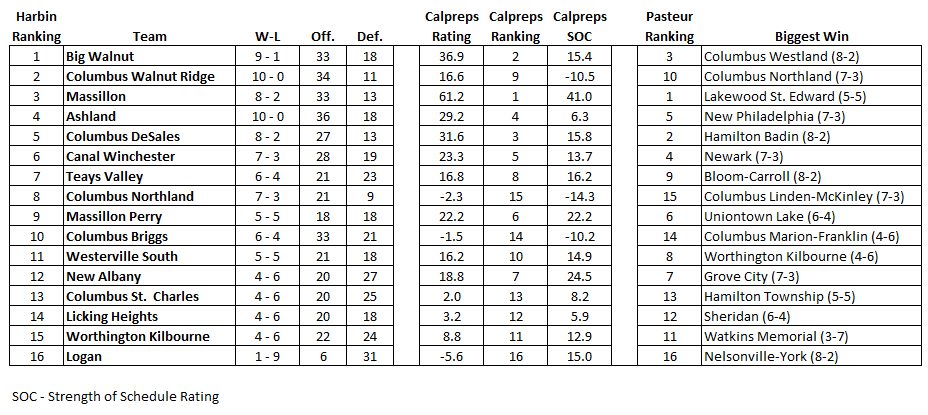
The chart shown below provides some limited background on each team, listed according to the bracket seeding position.

Win-Loss Records
Two teams fashioned undefeated 10-0 seasons: Columbus Walnut Ridge and Ashland. A third, Massillon, won all of its games against in-state competition. Big Walnut went 9-1, with a loss in the opener to unbeaten Columbus Watterson. Conversely, the five teams at the bottom finished with losing records, including Logan at 1-9.
Offense
The highest scoring team is Ashland, with 36 points per game. Behind them are Walnut Ridge at 34 and Big Walnut, Massillon and Columbus Briggs with 33. Fourteen of the 16 teams averaged at least 20 points per game. The only other teams that scored less than 20 are Perry at 18 and Logan at 6. So, how did Logan even make the list? Well, they have a win against Division V Nelsonville-York, which has a record of 8-2.
Defense
The team with the best scoring defense is Columbus Northland, with 9 points per game. The next best are Walnut Ridge at 11, and Massillon and Columbus DeSales at 13 apiece. Then there is Logan, at 31. They are just above New Albany’s 27, Columbus St. Charles’ 25, Worthington Kilbourne’s 24 and Teays Valley’s 23.
Strength of Schedule (SOC)
This is where the better teams often rise to the top. There is no question that Massillon played the strongest schedule, with the likes of Bergen Catholic, Lakewood St. Edward, DeMatha Catholic and Canton McKinley. Calpreps.com rated their strength of schedule at 41.0, well ahead of second-best New Albany at 24.5 and Perry at 22.2. The teams with the worst SOC are of course the inner-city teams: Northland (-14.3), Walnut Ridge (-10.5) and Columbus Briggs (-10.2).
Ratings
Three different rating systems are shown in the chart: Harbin System, Calpreps.com and Drew Pasteur’s Fantastic 50.
Harbin – This system uses the various schools’ male enrollments in order to divide teams into seven different divisions. Each division is comprised of four geographic regions, with each region conducting a regional tournament. A school’s rating for playoff qualification purposes is determined by using the number of regular season wins and the number of wins their defeated opponents earn (with consideration of enrollment classification).
Calpreps.com – This system uses an iterative mathematical algorithm that rates every team in the country. It involves using the margin of victory or defeat for each game plus the SOC rating to determine a team’s game performance rating. For any win, the team receive credit for a margin of at least 15 (regardless of the actual margin), but not to exceed 30. Likewise, for a loss, the credit also works in the opposite direction. However, game performance ratings are not included in the algorithm when the predicted margin for that game exceeds 30, unless the actual margin is within 30 points. The individual game performance ratings are then averaged to determine the final rating.
Pasteur – This system has similarities to that of Calpreps.com, except that it only includes Ohio teams.
Seeding Teams in the Bracket
The Ohio High School Athletic Association uses the Harbin System to select and seed teams for the playoffs. However, as pointed out numerous times in previous publications, the Harbin System is greatly flawed in that there is no consideration for SOC. It may be an acceptable tool for determining the best 12 teams when 16 are selected, it is by no means capable of generating a proper seeding of those teams. The drawback then is that several teams that would have earned a home game or two do not receive them.
When comparing the rankings of both Calpreps.com with Pasteur, one finds a 97% correlation between the two, which demonstrates credibility with an algorithm-based system. However, when comparing Harbin with Calpreps.com, one finds a correlation of just 55%. That is why up to a quarter of the higher seeded teams within the Top 3 divisions in last year’s playoffs lost in the first round.
This year, there are two inner-city teams in the Region 7 Top 8 (seeded 2nd and 8th), each having good records and scoring numbers, but with very poor SOCs. Plus, the consensus best team in the entire group, Massillon, is seeded third.
Round 1 Games
- 16 Logan at No. 1 Big Walnut – Easy win for Big Walnut
- 15 Worthington Kilbourne at No. 2 Columbus Walnut Ridge – Walnut Ridge by a touchdown
- 14 Licking Heights at No. 3 Massillon – Massillon; name the score
- 13 Columbus St. Charles at No. 4 Ashland – Big win for Ashland
- 12 New Albany at No. 5 Columbus DeSales – DeSales by a couple scores
- 11 Westerville South at No. 6 Canal Winchester – This one might be close
- 10 Columbus Briggs at No. 7 Teays Valley – To problem for Teays
- 9 Massillon Perry at No. 8 Columbus Northland – This one goes to the visitors by three scores
